Report View
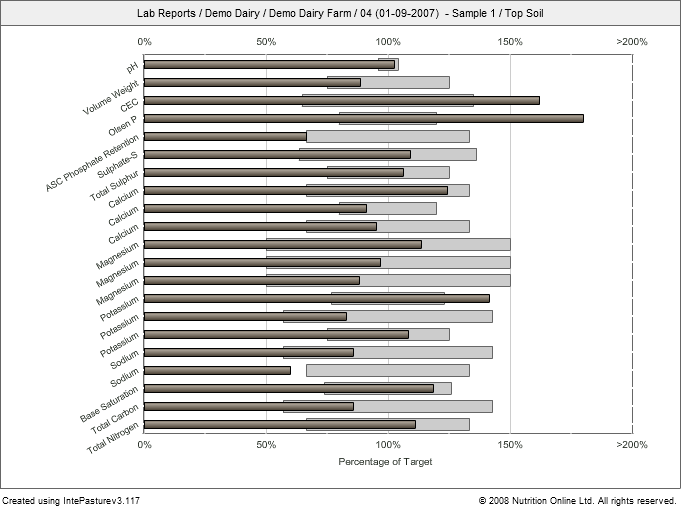
Over the years, you've probably gathered a lot of data about your farm. It’s all there, somewhere: laboratory reports, paddock measurements, production statistics going back many seasons. The challenge is to keep track of all this valuable data, and collate it into one consistent view just whenever you need it. This is precisely what Intepasture does, placing all the data at your fingertips. Soil and herbage test results, Dry Matter production data - it’s all there, going back in time as far as you want.
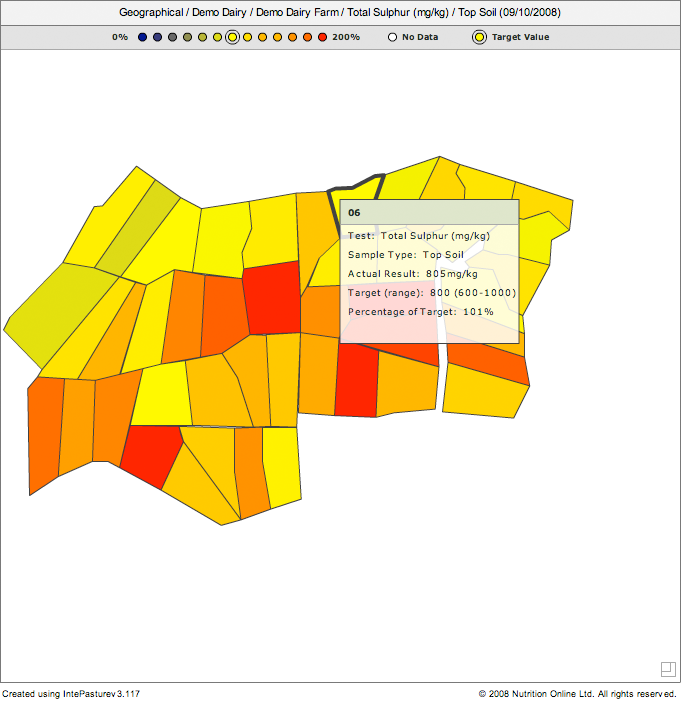
The Report view in IntePasture displays data in a horizontal bar-graph format, normalised to a consistent scale. This means that reports from different sources are all presented in the same, easy to understand way. At a glance, you can see the significance of each measurement, regardless of its units of measure. The bars are colour coded to provide a quick visual indication of the sample matrix (in this case, pale brown indicates that its sub-soil data).
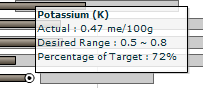
Each analyte - the thing being measured - has its own desired range, indicated in the Report view by grey bars. Moving the mouse over each bar will show the analyte name, the actual measurement value and units of measure, the desired range values for that analyte, and the percentage of actual versus target.
Historical View
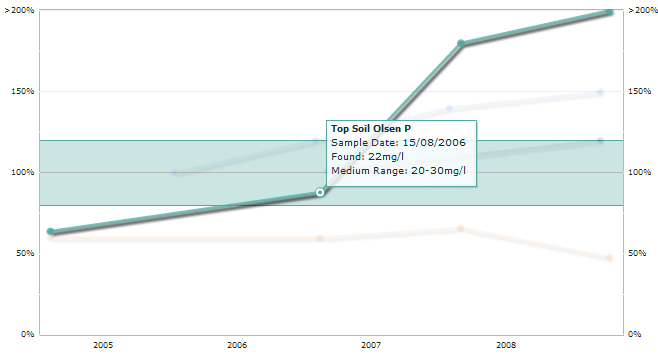
IntePasture's Historical view gives you easy-to-navigate trend charts that you can quickly customize to your own specific requirements. With these you can see important trends and relationships between the effects of nutrient management on test results and production.
A single piece of data can turn into valuable information when seen in the context of time & other measurements.
The more data you add to IntePasture, the more valuable it becomes. As each season goes by, you'll be able to discover trends that will probably prompt you to dig even deeper into your wealth of data.
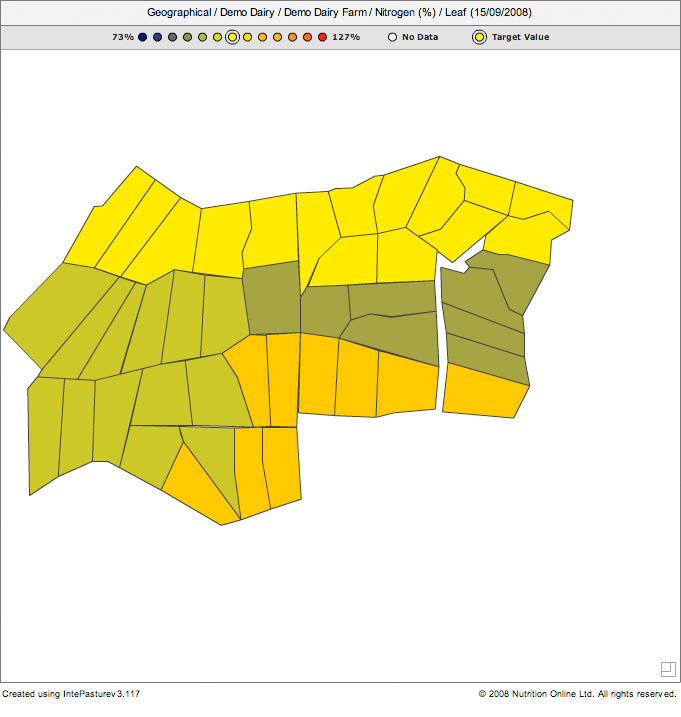
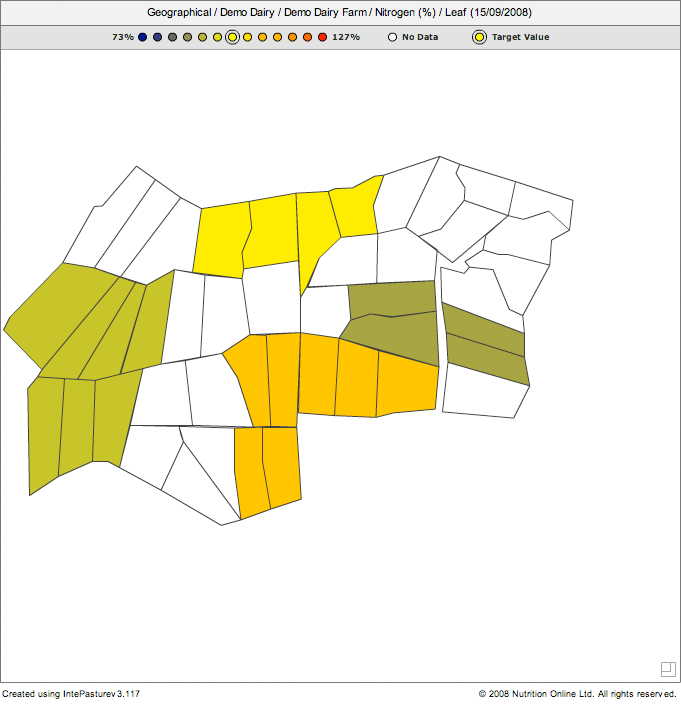
Geographic View
"A picture is worth a thousand words"
IntePasture has been carefully designed to allow large, complex sets of data to be easily visualised. Thanks to IntePasture's deliberately uncluttered and intuitive design, you'll soon find that exploring your data has never been easier.
Zones
IntePasture uses the concept of 'zone' (or management unit) to cater for situations where a group of paddocks with similar characteristics are managed as if they were one block. A group of blocks might be grouped into the same zone because they all share a common factor, like paddocks that are cropped regularly, or because they share a common soil type.
Typically all paddocks in the same zone will receive the same fertiliser application rates and formulations. In some cases it makes sense to only test a selection of 'monitor' blocks within a zone, rather than testing every block every year. But often it is a good idea to test all paddocks at some point (All Paddock Testing) to get a good indication of the variability of your farm and where to concentrate nutrient inputs.
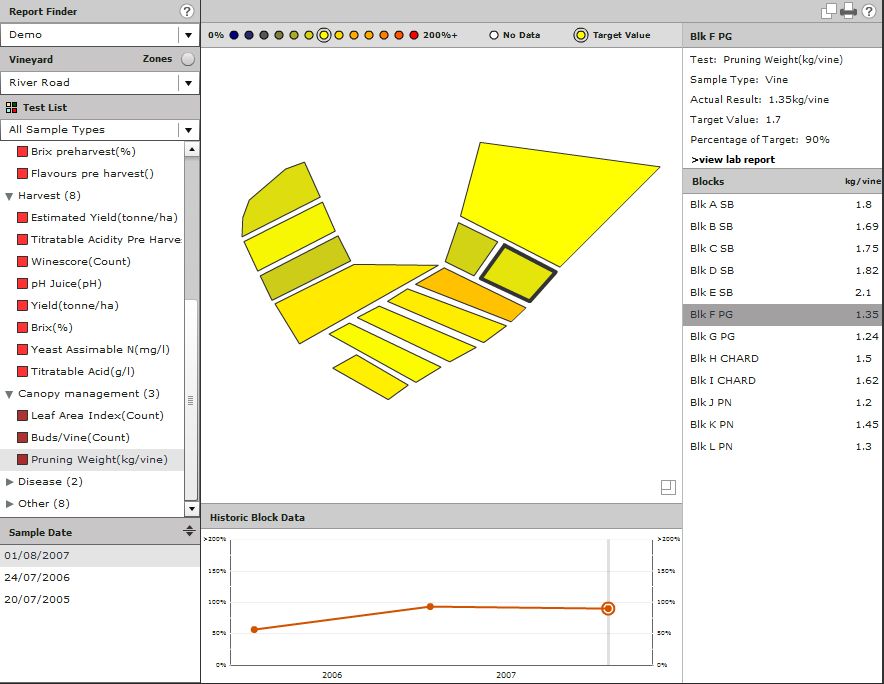
The following illustrates how 'zones' work in Geographic Data view (they also apply in Historical Data view). In this case, a farm has 45 individual paddocks organised in 4 zones or management units. In the usual Geographic view, data for each of these blocks is displayed individually. Switching on the Zone filter allows the grower to see trends and average data by variety, rather than just by individual paddock.